Q3'21: Passive Aggression

By: Jack Schibli
As a reminder, this blog is an outlet for our thoughts, primarily on the macroeconomic environment, which contextualize our investments. Please subscribe to receive future post notifications.
Tragedy of the Commons? 🐑
Jack Bogle, the founder of Vanguard and father of passive investing, launched the first index fund in 1976 on the premise that market prices are efficient and therefore investors should be price takers rather than price makers. Bogle believed after the consideration of management fees, operating expenses, sales loads, and embedded tax inefficiencies, the average fund at the time could easily reach 3% per year in fee friction, "virtually guaranteeing that fund investors as a group would experience a substantial shortfall to the market"[1]. Despite industry-wide fee compression, this phenomenon remains true today. Over the last 10 years just 18% of large-cap funds have outperformed the S&P 500 and over a 20-year time frame that cohort declines to just 6%[2]. 
For Illustrative Purposes Only
In light of the above data and the increased sensitivity of investors towards fees, it should come as no surprise that active managers have ceded assets to passive strategies at a remarkable rate. Part of this sea change is demographically driven. Baby Boomers are entering retirement and forced to take Required Minimum Distributions (RMDs) annually from their retirement accounts, which often hold active mutual funds invested in at the time of contribution. Meanwhile, the Millennial generation is disproportionately choosing passive, as they enter their prime investing years (25-40) and simultaneously begin the inheritance of $70 trillion by 2042[3]. Passively managed funds now account for over 40% of total assets, up from under 25% in 2010[4].

For Illustrative Purposes Only
The logical question becomes: at what point do passive funds become price makers rather than price takers? Passive index funds are price-insensitive buyers that follow a simple set of rules: If(inflow), Buy(basket). If(outflow), Sell(basket). This behavior serves to increase the correlation among securities in the same basket since they are all bought and sold at the same time. In the S&P 500, basket weights are determined by the float-adjusted market capitalization of companies in the index. For example, Apple's weight in the S&P 500 is currently 5.98%, while Alaska Air, ranked 495th, is 0.017%[5]. For every $100 invested in an S&P 500 index fund, nearly $6 is invested into Apple and less than 2 cents or 350 times less is invested in Alaska Air. Are the liquidity impacts of these flows equivalent? If the price elasticity of demand for shares of Apple is less than the price elasticity of demand for shares of Alaska Air then, all else equal, we would expect the percentage change in the price of Apple as a result of this flow to be greater than the percentage change in the price of Alaska Air. The resulting effect is an increase in Apple's weight in the index in comparison to Alaska Air's weight in the index, creating a reflexive loop whereby the flow itself impacts the allocation of future flows.
Markets are ultimately driven by supply and demand for shares. Apple has aggressively leveraged the low-rate environment to borrow money in order to buy back shares, decreasing shares outstanding and driving the price per share higher. Since the beginning of 2013, shares have Apple have appreciated nearly 7-fold, while Apple grew revenue just 134% over the same period[6].

For Illustrative Purposes Only
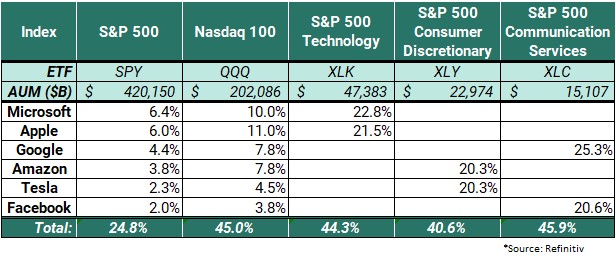
The mechanics of passive index funds mean any outperformance of a company relative to others in the index is rewarded with a larger allocation at the next quarterly index rebalancing. Therefore, it can be argued the S&P 500 is a de facto growth-tilted, momentum-chasing, active strategy. This virtuous loop is partially responsible for the accelerated outperformance of FANGMAN (Facebook, Apple, Netflix, Google, Microsoft, Amazon, and Nvidia). Together, these 7 stocks currently receive almost 25 cents of every dollar invested in the S&P 500, up from 6 cents in 2013[5]. Conversely, the entire energy sector comprised 11.5% of the index in 2013, but now represents a measly 2.9%, a reflection of passive indexing's ruleset to decrease the allocation of underperforming components[5]. Compounding the problem are what's known as "closet indexers". These are actively managed funds benchmarked to the S&P 500, which therefore closely align their portfolio exposure to that of the index to minimize tracking error. This usually means owning the mega-caps, since they can duplicate more exposure to the benchmark with fewer positions. Oftentimes it's the very large funds that are held captive to this behavior since their AUM is prohibitive, in the sense that owning a 1% position for a $100B fund would require a $1B investment, creating illiquidity risk anywhere but large-cap equities.
The mantra of active investors is "buy low, sell high". This idiom manifests mean reversionist tendencies whereby overvalued securities tend to decline and undervalued securities tend to increase. However, passive index investing has no consideration for price, and instead follows the ruleset: "buy high, buy higher". This dynamic has created evermore concentration within indices. Are investors in the Nasdaq 100 aware 45 cents of every dollar are invested in 6 companies? So much for diversification, a purported benefit of passive investing.
For Illustrative Purposes Only
Follow the Flows 🌊
It’s ironic that passive index investing is supplanting the very basis on which it was founded. Perhaps more ironic, its creation of market inefficiencies actually increases the opportunity set available to active managers. As the passive share of equity markets rises, flows become a larger determinant of price, at the expense of fundamental value.
Tesla's meteoric rise into the S&P 500 is a case study on the inclusionary effect. Let’s start by clarifying the misconception that the S&P 500 is a representation of America’s 500 largest companies. It is instead an index of (more than 500) companies that the S&P 500 US index committee selects at their discretion to represent blue-chip America. Incidentally, Tesla’s market cap was nearly twice that of the smallest company in the index on June 29, 2010, the day of its IPO[7].
On November 16th, 2020, the S&P index committee announced Tesla would be added to the index at the open on December 21st, 2020. This left traders more than a month to front-run the wave of forced buyers, which they unsurprisingly took advantage of. Shares of Tesla rose 70% between the announcement and official inclusion, where it received a 1.69% weighting in the S&P 500, making it the 6th largest company in the index[6,7]. Constrained by tracking error, passive index funds purchased their shares on the close of the prior trading day, 25% of shares outstanding traded hands, amounting to $150 billion dollars in volume[6].

For Illustrative Purposes Only
Passive indexers piled into Tesla at what was then its all-time high. Tesla has since been accretive to the index, as captive passive buyers swallowed a significant portion of the float and further fueled another reflexive loop: speculators' incessant and excessive call option purchases. It was reported that one late October day saw the volume of options premiums for Tesla exceed that of every single other option in the market combined, a universe of more than 5,000 equities and ETFs[8]. This speculative fervor has driven Tesla well on its way toward Elon Musk’s goal for humanity: Mars. However, at the next quarterly rebalancing, passive indexers won’t be cashing in their gains, but instead nearly doubling down on Tesla, as its outperformance relative to the index has increased its share of the pie.
In the last 45 days, Tesla has added to its market cap more than the combined value of Ford, General Motors, Fiat Chrysler, Ferrari, and Volkswagen[6]. A statistic rather mind-boggling, but somewhat rationally explained by a key tenant of any market; the marginal buyer sets the price. On the other side of this constant demand for shares is a shareholder base reluctant to part with its shares. Their demand curves are highly inelastic, a concept that can be applied to markets at large. A fascinating study by Xavier Gabaix and Ralph Koijen empirically found that investing $1 in the stock market increases the aggregate value by about $5[9]. They highlight "households allocate capital to institutions, which are fairly constrained, for example operating with a mandate to maintain a fixed equity share or with moderate scope for variation. As a result, the price elasticity of demand of the aggregate stock market is small, so flows in and out of the stock market have large impacts on prices"[9].
Musical Chairs 🎵
The macro environment continues to suggest that asset allocations towards equities will continue to increase relative to fixed income. This prolonged period of negative real rates eats away at purchasing power and starves investors of yield. Institutions, including pension funds and endowments, with return hurdles in the neighborhood of 7.5% per annum must continue to take on more risk to meet their objectives.

For Illustrative Purposes Only
The combination of increased flow into passive indexing (read: momentum) vehicles and the inelasticity of demand of market participants cause price movements to accelerate to the upside. We believe this has been an underappreciated driver of markets. The pundits calling on valuation extremes and bubble territory are not wrong about fundamentals, but in this market regime, they have simply been a lesser determinant of price. Ultimately, we believe fundamental value will be appreciated over the long term, for when there is a run on liquidity and a reversal of flows it will be the declining population of active managers who step in to set the price. Until then, keep calm and carry on, it seems.
__________________________________________________________________________________________________________________________________________
Disclosures
The information provided is for educational and informational purposes only and does not constitute investment advice and it should not be relied on as such. It should not be considered a solicitation to buy or an offer to sell a security. It does not take into account any investor's particular investment objectives, strategies, tax status, or investment horizon. You should consult your attorney or tax advisor.
The views expressed in this commentary are subject to change based on market and other conditions. These documents may contain certain statements that may be deemed forward‐looking statements. Please note that any such statements are not guarantees of any future performance and actual results or developments may differ materially from those projected. Any projections, market outlooks, or estimates are based upon certain assumptions and should not be construed as indicative of actual events that will occur.
All information has been obtained from sources believed to be reliable, but its accuracy is not guaranteed. There is no representation or warranty as to the current accuracy, reliability, or completeness of, nor liability for, decisions based on such information and it should not be relied on as such.
No investment strategy or risk management technique can guarantee returns or eliminate risk in any market environment. All investments include a risk of loss that clients should be prepared to bear. The principal risks of Lane Generational strategies are disclosed in the publicly available Form ADV Part 2A.
This report is the intellectual property of Lane Generational, LLC, and may not be reproduced, distributed, or published by any person for any purpose without Lane Generational, LLC’s prior written consent.
For additional information and disclosures, please see our disclosure page.
Sources
[1] Bogle, John. The Professor, the Student, and the Index Fund. September 2011.
[2] S&P Dow Jones Indices. SPIVA U.S. Score Card. 2020.
[3] Cerulli Associates. The $70 Trillion Dollar Opportunity: Understanding the Implications of Multigenerational Wealth Transfer. 2020.
[4] Kevin McDevitt, Nick Watson. The Decade in Fund Flows A Recap in 5 Charts. Morningstar Research Services LLC. 2020.
[5] S&P 500 Companies by Weight. Slick Charts. July 2013 & November 2021.
[6] Refinitiv Data.
[7] Bernard Sharfman, Vincent Deluard. Discretionary Decision-Making and the S&P 500 Index. Columbia Law School Blog. March 30, 2021.
[8] Banerji, Gunjan. Traders Bet Tesla Stock's Rally Isn't Over Just Yet. The Wall Street Journal. October 28, 2021.
[9] Xavier Gabaix, Ralph S.J. Koijen. In Search of the Origins of Financial Fluctuations: The Inelastic Markets Hypothesis. August 10, 2020.