
Q2'26: Poker Face

By: Jack Schibli
As a reminder, this blog is an outlet for our thoughts, primarily on the macroeconomic environment, which contextualizes our investments. Please subscribe via the form at the bottom of the page to receive future post notifications.
If you are interested in learning more about our investment strategies, please kindly fill out our contact form here.
TLDR: – "too long; didn’t read."
- In our view, markets are fundamentally broken, meaning price discovery is no longer value driven.
- The game has changed because the players have changed – prices now primarily reflect flows and momentum, rather than fundamentals.
- Passive investing and corporate buybacks serve to shrink the effective and absolute available quantity of shares, increasing inelasticity of supply.
- This price-agnostic capital, combined with behavioral changes amongst active players, amplifies the reaction to changes in a company’s fundamentals.
- We believe the resulting effect is a momentum driven market, with more illiquidity, volatility, and ultimately, fragility.
The saying goes, “don’t hate the players, hate the game.” Well, it might be time to “hate” one particular “player” in this game of markets we play. A recurring topic on this blog is the dramatic shifts in modern market structure that are directly impacting outcomes. The game has changed because the players have changed. We will run through each major player at the table, their behaviors, and our hypothesis of their collective impact on markets.
Passive Investing🐑
By a country mile, passive investing’s share gain is the largest shift in market structure over the last decade. Passive investing is conventionally defined as index investing, meaning a chosen index is replicated by investing in every company listed in the index at the index-determined weight. Vanguard’s Jack Bogle launched the first index fund in 1976 on the premise that market prices are efficient and therefore investors should be price takers rather than price makers. His theory was exceptionally sound at the time, but does it hold water if passive investors outnumber their active counterparts? According to Apollo, passive’s share of U.S. equity funds was approaching 60% in 2024, and is likely higher today. This figure understates the penetration, as many active funds are closet indexers masquerading as active managers. In fact, some active funds even market themselves as being majority passive, with some active around the edges, in an attempt to achieve index returns plus a few hundred basis points.
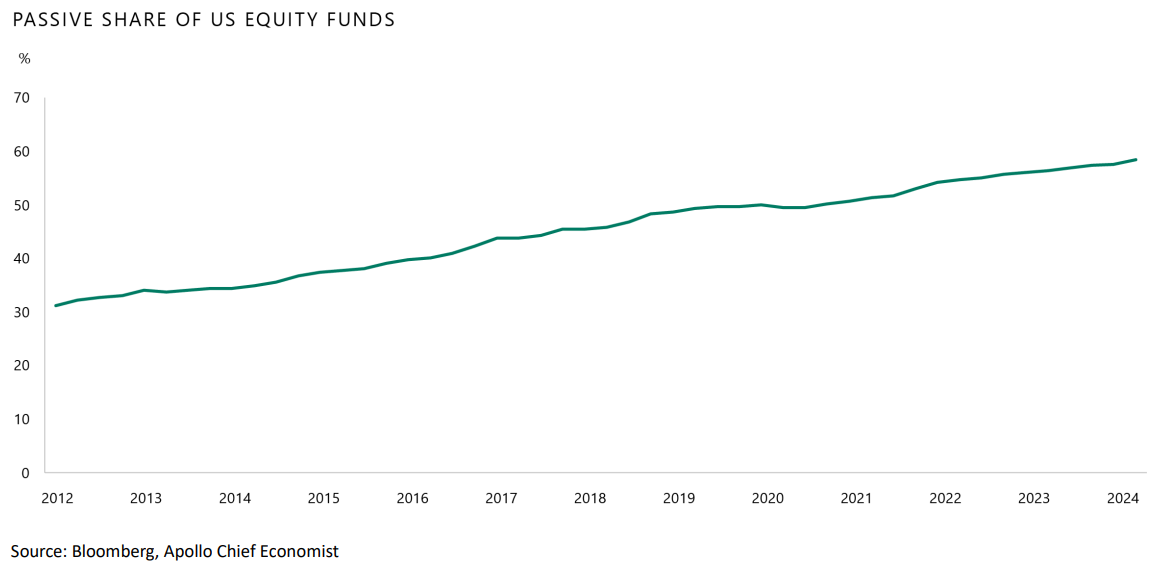
Unfortunately, passive investing appears to be a tragedy of the commons – a term used in economics to describe how individuals acting rationally in their own self-interest can collectively (and often unknowingly) disrupt an environment through overuse. Taken to the extreme, assume the market is 100% passive, meaning there are no active participants involved in assessing the value of individual securities. In this scenario, there is no arbiter of value; rather, market outcomes are determined solely by flows. Active managers are dying a slow death as years of underperformance have led to outflows in favor of passive. Passive strategies are price-insensitive buyers that follow a simple set of rules: If(inflow), Buy(basket). If(outflow), Sell(Basket).
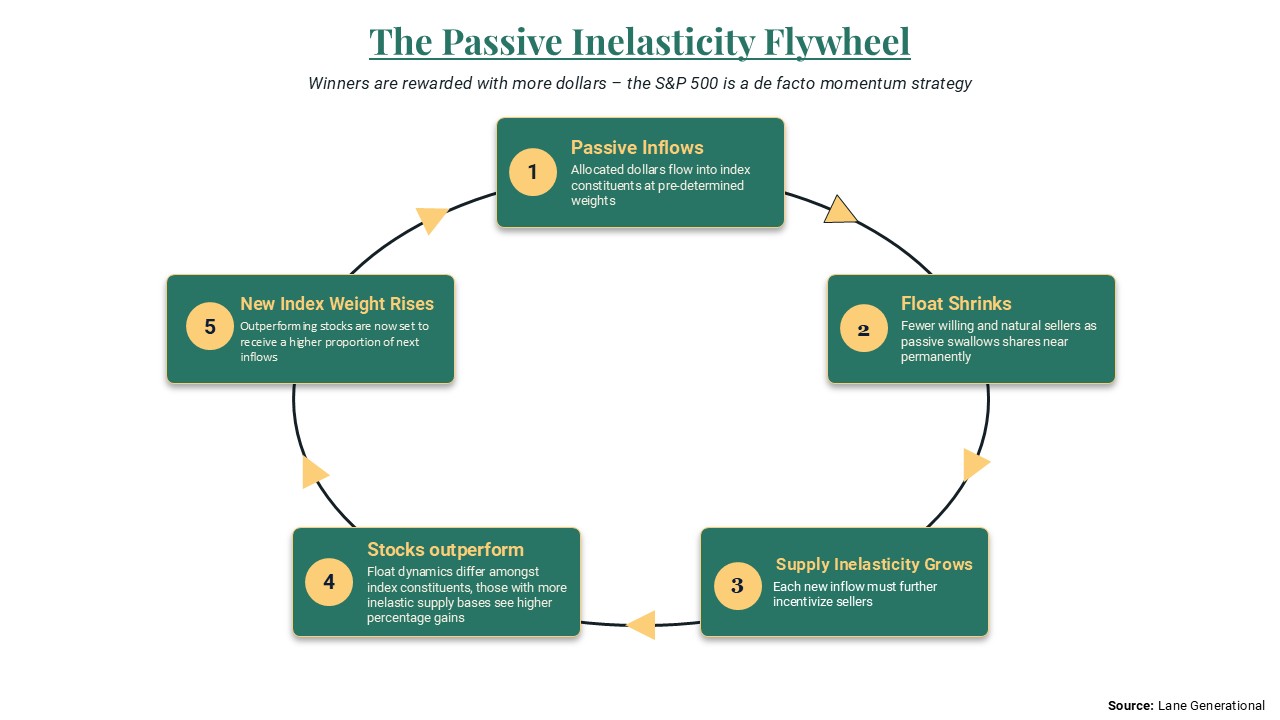
A deeper look at the mechanics of passive strategies reveals a heavy momentum bias. In the S&P 500 index, weights are determined by the float-adjusted market capitalization. In practice, this means large companies are rewarded with more dollars than smaller companies. For every $1000 entering the S&P 500, $75 is allocated to Nvidia (largest) and 9.7 cents is allocated to Molson Coors (smallest). Passive indexing fails to account for its own impact on the available supply of shares. For example, roughly $33 billion per month flows into U.S. equities from 401(k) contributions, most of which is passively allocated. These passive dollars are allocated as buy orders across all companies in the index per index weights. Buy orders must find willing sellers, and as passive strategies absorb shares and shrink the effective float, each marginal seller becomes less willing to sell. The key is that this inelasticity dynamic is NOT evenly distributed across index participants. The increasingly inelastic remaining supply drives larger percentage changes in price for each marginal dollar of inflows. This means outperformance of the underlying stock, which equates to a higher percentage of the basket at the next inflow interval. Given this dynamic, we argue that the S&P 500 is a de facto momentum strategy – stocks that perform well are further rewarded, and those that perform poorly are further shunned.
Corporate Buybacks🖨️
This brings us to our next player at the table – the corporations themselves. In 2025, companies bought back a whopping $1.46 trillion of their own stock. However, buyback capacity is highly concentrated among the largest companies, driven by high levels of profitability and easy access to capital, with just 20 firms accounting for 32% of buyback volumes. In many cases, firms even tap debt markets to fund buybacks, as does Apple, the world’s largest share repurchaser. Large companies are shrinking shares outstanding – in Apple’s case, meaningfully so, as shares outstanding have decreased ~44% since peaking in 2012.
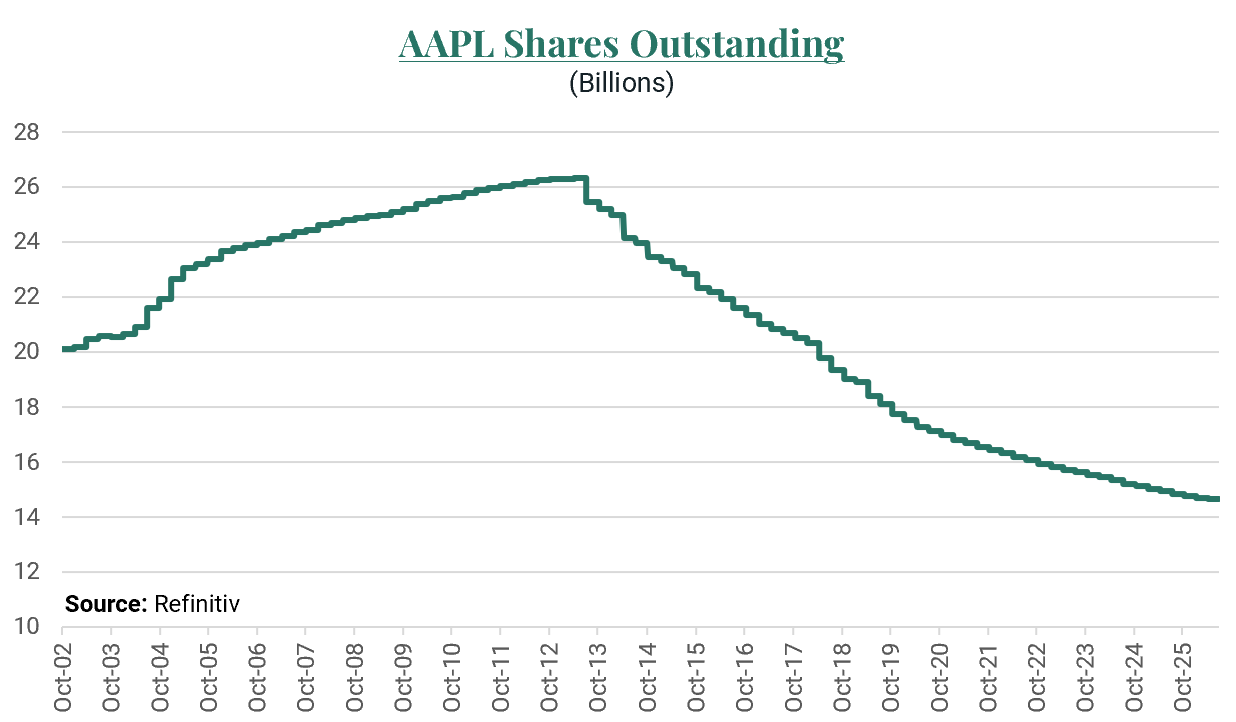
Corporate buybacks are literally shrinking the float. When combined with passive’s effective shrinking of the float, this further amplifies supply’s inelasticity. Corporations are also typically price-insensitive buyers, executing repurchase plans at a predetermined cadence set by the board. Large corporations do not appear valuation sensitive, as despite rising multiples, board-authorized share repurchase programs continue to increase.
Now we’ll walk through our hypothesis of how an emergent pocket of strength is amplified into strong momentum with the entrance of other players at the table. Throughout this section, keep in mind how the price-insensitive buyers listed above might further amplify the momentum created.
Multi-Manager Hedge Funds – “Pod Shops”🫛
Multi-manager funds, often referred to as “pod shops,” are collections of dozens, and sometimes hundreds, of independent portfolio managers (pods) under one roof. All managers are typically subject to very strict risk management rules, for example - a 50% reduction in capital allocation in the event of a 5% drawdown. The concept is to have many uncorrelated strategies on a tight risk leash produce low-single-digit aggregate returns, which are apparently so reliable they are comfortable running an average of 444% leverage. Thus, while multi-strat assets under management are roughly 10% of total hedge fund assets, Goldman Sachs estimates they are closer to one-third of the gross market value managed by hedge funds.
As a by-product of cutthroat competition and risk constraints, individual managers have very little patience for investing in any area of the market not immediately “working”. This tends to focus their efforts on very short-term catalysts, often turning over the entire portfolio 9-12x a year. The combination of leverage and high turnover drives their share of US equity trading volume to an estimated 30%. As the most active capital in the market, pod shops are perhaps the key marginal price setters. By nature of their short-termism, pod shop capital is also relatively price agnostic, as valuations are long-term weighing machines but have little correlation with short-term direction. While it is difficult to prove, we suspect pod shops are a key driver of heightened event volatility, whether that be news releases, earnings reports, or other market moving headlines. In other words, when something fundamental changes, pod shops get in (or out) very quickly and in large size. This leads us to believe pods are the ignition for momentum pockets in the market.
CTAs/Trend Followers & Vol Control/Risk Parity 📈
Our next player is run by a computer without human oversight. Trend following is one of the most basic applications of technical analysis. The basic premise is not materially different than Newton’s First Law of Motion – an object in motion will remain in motion. Quantitative algorithms are constantly screening companies, sectors, and even broad indices to determine whether prices meet their definition of a trend, which can be as relying on a simple moving average.
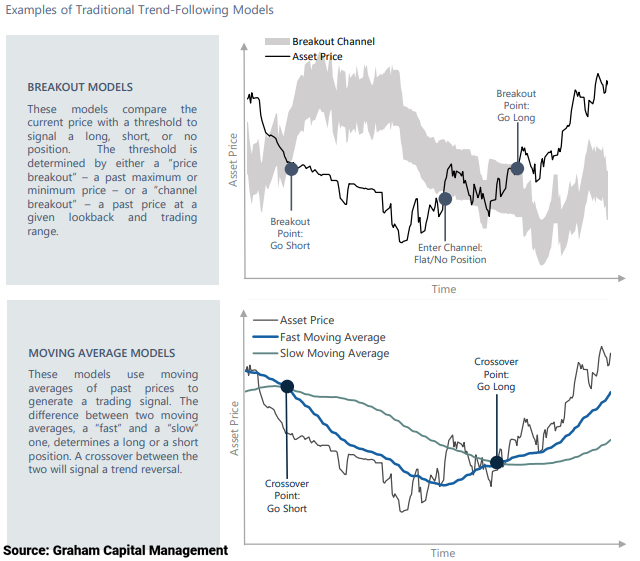
These strategies seek to identify changes in trend, enter positions, and hold until the trend breaks. Trend-following strategies identify emerging momentum (perhaps initiated by our pod shops) and amplify it. Yet again, this is price-insensitive and value-agnostic capital following a predetermined set of rules.
It’s worth touching on volatility control and risk parity strategies, which are not focused on single stocks and therefore don’t play a major role in our causal chain but do play a meaningful role at the index level. Risk parity strategies allocate across asset classes (primarily equities and bonds) based on each asset’s contribution to portfolio risk rather than its dollar weight, typically by levering the bond sleeve to match equities. Meanwhile, vol control strategies, often used by annuities and insurers, apply similar logic, but more bluntly, toggling exposure based on realized volatility. Both are yet another flavor of price-insensitive capital, increasing exposure in calm markets and shedding amidst chaos. These strategies are an important flow to indices and serve to compound downside moves during volatility spikes.
Retail🎰
Long known for their attraction to hot stocks driven by their desire to “get rich quick”, retail next enters the fold. Retail investing has undergone its own dramatic shift over the last decade, as modern brokerages such as Robinhood have leaned into “gamifying” the investing experience and put the ability to access commission-free trading in your pocket. Retail participation in U.S. equities has risen to nearly 20% of average daily trading activity, up from low-single digits before the pandemic.
Social media has played a major role in shaping retail investor behavior. Through social platforms such as X.com, Reddit, and StockTwits, as well as chat-room platforms like Discord and Telegram, retail investors are constantly seeking the next big story stock. This study found that the median individual investor spends just six minutes researching before placing a trade. Their short attention spans mean attention converges on what is popular across various message boards, resulting in meaningful concentration in a small number of stocks. Researchers, aptly naming this behavior “herding”, found that 35% of net buying by Robinhood users was concentrated in just 10 stocks. Retail then bets (not invests) big.
Thanks to their gambling orientation, retail investors are seeking leverage to their trades and can now access it through leveraged ETFs and options. Options trading has exploded in recent years, particularly after the Chicago Board Options Exchange launched 0DTE (zero days to expiration) options on major indices in 2022, and more recently the addition of Monday and Wednesday options (on top of traditional weekly) for a select list of “high volume securities”. As you might expect, there is a high overlap with retail favorites. We believe retail capital amplifies the emerging momentum pockets first identified by pod shops and compounded by trend followers.
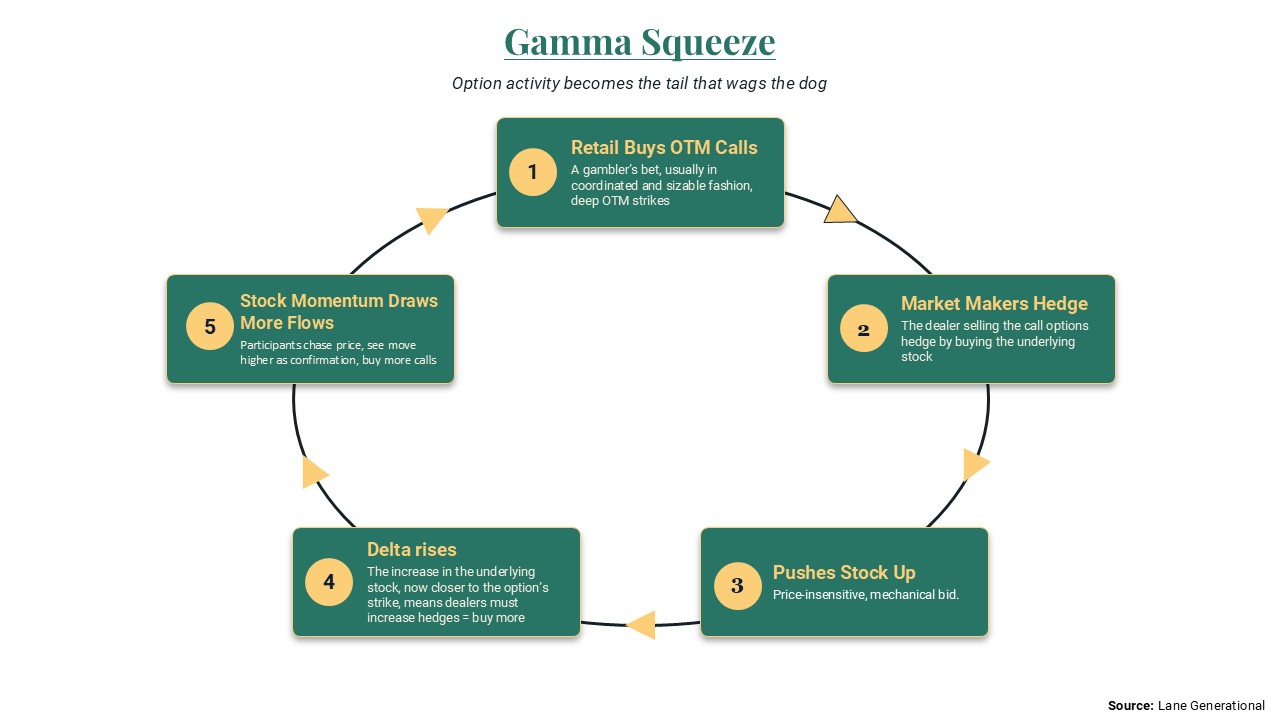
Retail’s use of options accelerates the trend through the positive gamma feedback loop – a gamma squeeze. Gamma is the rate of change of delta, where delta is the measure of the expected change in an option’s price for every $1 move in the underlying security. When a call option is purchased from a market maker, the market maker must hedge its exposure to the call option. Typically, market makers use some variation of the Black-Scholes model to do so, which dynamically dictates how many shares of the stock in question should be purchased based on price, time to expiry, and implied volatility. The takeaway is that when retail enters a stock with high out-of-the-money call option activity, they are forcing dealers to buy the underlying stock, adding yet another price-insensitive buyer to the ring. Compounded by the aforementioned flows, the stock begins to experience larger percentage gains (an acceleration) due to the inelasticity of supply. This attracts more momentum focused capital and call option activity, an almost self-fulfilling prophecy, as option activity is the tail that can wag the dog.
Traditional Hedge Funds & Long-Only👔
These are two different players but we believe act somewhat similarly. We believe hedge funds are earlier to emerging themes than their traditional mutual fund counterparts. At the end of the day, all players are in search of returns, and when significant outperformance comes from certain pockets of the market, they must participate or risk being left behind their benchmarks. These managers are typically fundamentally driven, but at this point there is a strong fundamental narrative to accompany the positive price action, making it easy to get on board. Recall that we believe the origination of this causal chain is pod shops driving sharp short-term moves in response to fundamental improvements. Thus, fundamentals start the trend, but a chain of several price-agnostic buyers carries it much further than the fundamental change might suggest.
Post-Mortem & Examples⚠️
This assessment of each player at the table, and their behavioral tendencies, is an oversimplified, generalized working hypothesis. However, we believe it is undeniable that modern market structure has created a market that is more momentum driven, more illiquid, and more volatile. Importantly, the positive momentum loop described also works in reverse. Price action reflects supply and demand for shares, and eventually it becomes difficult to find incremental demand if most market participants are already invested in a theme or company.
We observe this reversal begins with a fundamental negative update (relative to consensus), which drives pod shop selling. This causes short-term trend lines to break, pushing trend followers out. Retail’s call options stop working, and market-makers unload their hedged shares. At this point, the stock is now firmly in a downtrend, which is compounded by passive selling as it underperforms the index. Fundamental managers are now beginning to question their thesis, ashamed they paid such a high multiple of earnings in the first place. The stock languishes; capital rotates elsewhere. The downtrend seems likely to continue until the valuation is just too cheap to ignore, attracting value-oriented buyers to step in and stabilize the stock.
Let’s walk through some examples. The quintessential upside candidate of this hypothesis is Palantir Technologies. A company we are very familiar with because we owned it during this period. The stock posted sequential earnings beats in early 2023, thanks to the positive inflection of the company’s AI offering. The stock jumped quickly and significantly off its lows, breaking a multi-year drawdown trend during which it fell 85% from peak to trough in the wake of the 2021 IPO/SPAC boom. The positive trend inflection attracted early momentum buyers and trend followers, which would continue through the next several quarters of consecutive positive earnings surprises. Amidst the early ascent, the company announced a share buyback plan to reduce the negative supply impact of its employee stock issuance programs. In late 2024, Palantir was added to both the S&P 500 and Nasdaq 100, inciting the trillions of dollars of passively managed assets under management to pile in – these flows were heavily front run, as they are one of the few guarantees of demand in markets. With Palantir on its way to becoming a household name, retail investors then initiated leveraged exposure via heavy call option volumes and the listing of PLTR-only leveraged ETFs. Active managers (us included) could hardly believe their eyes. The stock traded to a peak of 310x FY(1) earnings in late 2025 (we were long gone), exceeding Cisco’s peak multiple in the dot-com bubble. The stock gained an astounding 33x from its low just three years prior.
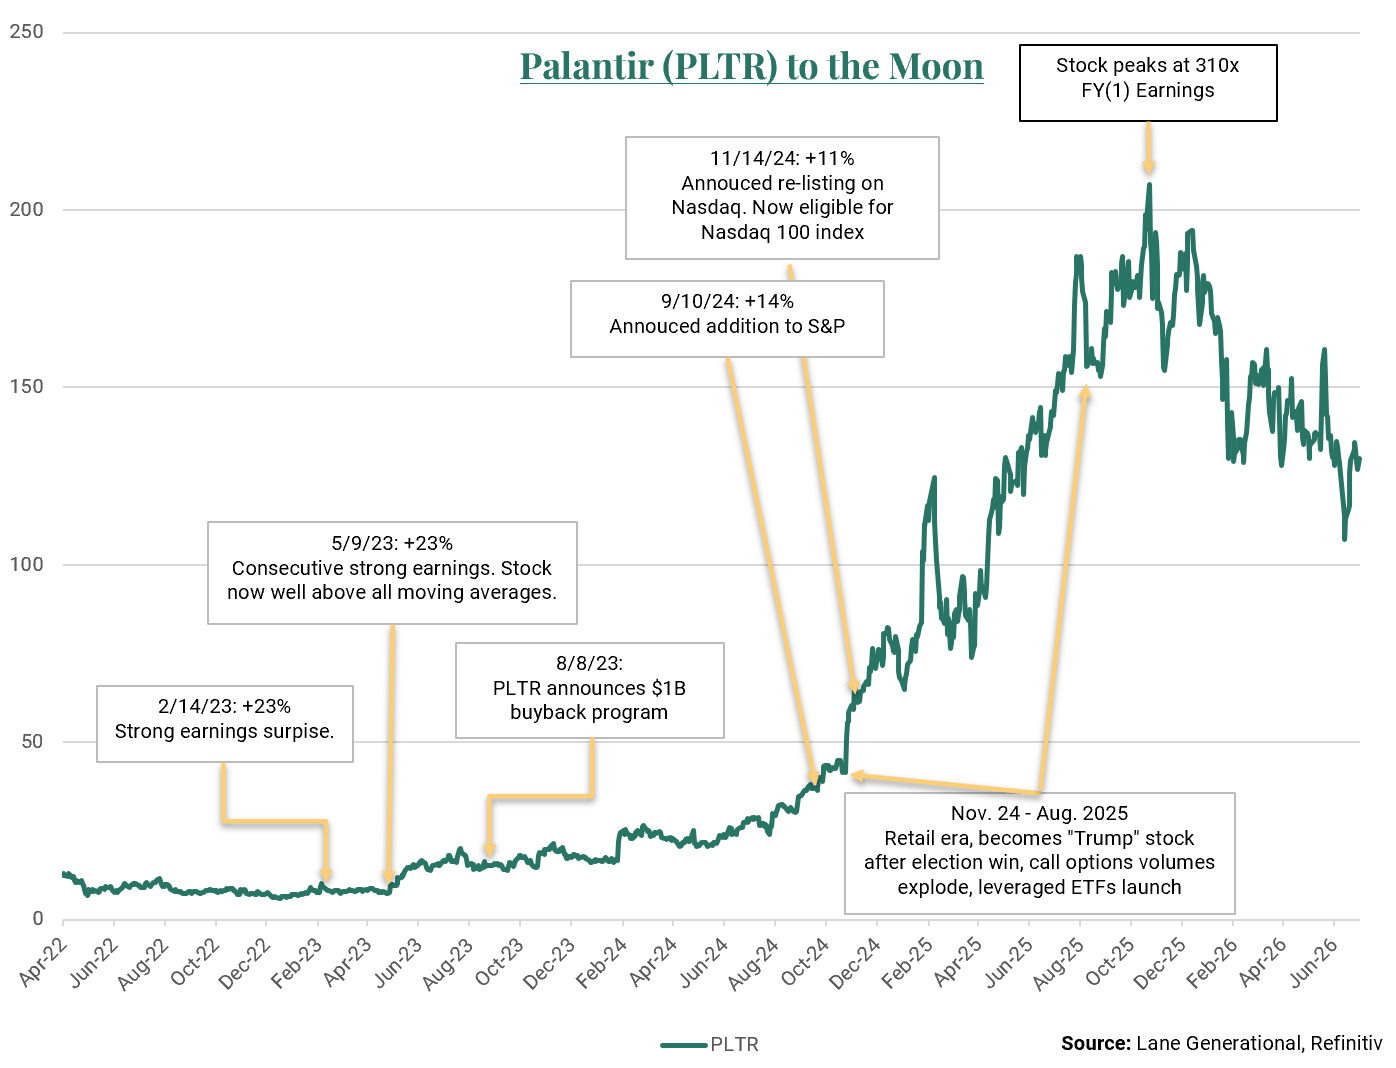
We submit that modern market structure caused Palantir to overshoot to the downside in 2022 and far, far overshoot to the upside in 2025. Yes, fundamentals improved materially during the period, but there is no active manager with any inkling of fundamental value who would buy a stock at 100x earnings, let alone 310x. Next, our downside example, Lululemon, exhibits the same phenomenon in reverse. The stock shouldn’t have traded as high as it did, absent price-insensitive buyers taking it there. Unfortunately, when you fly too close to the sun, small missteps are punished.
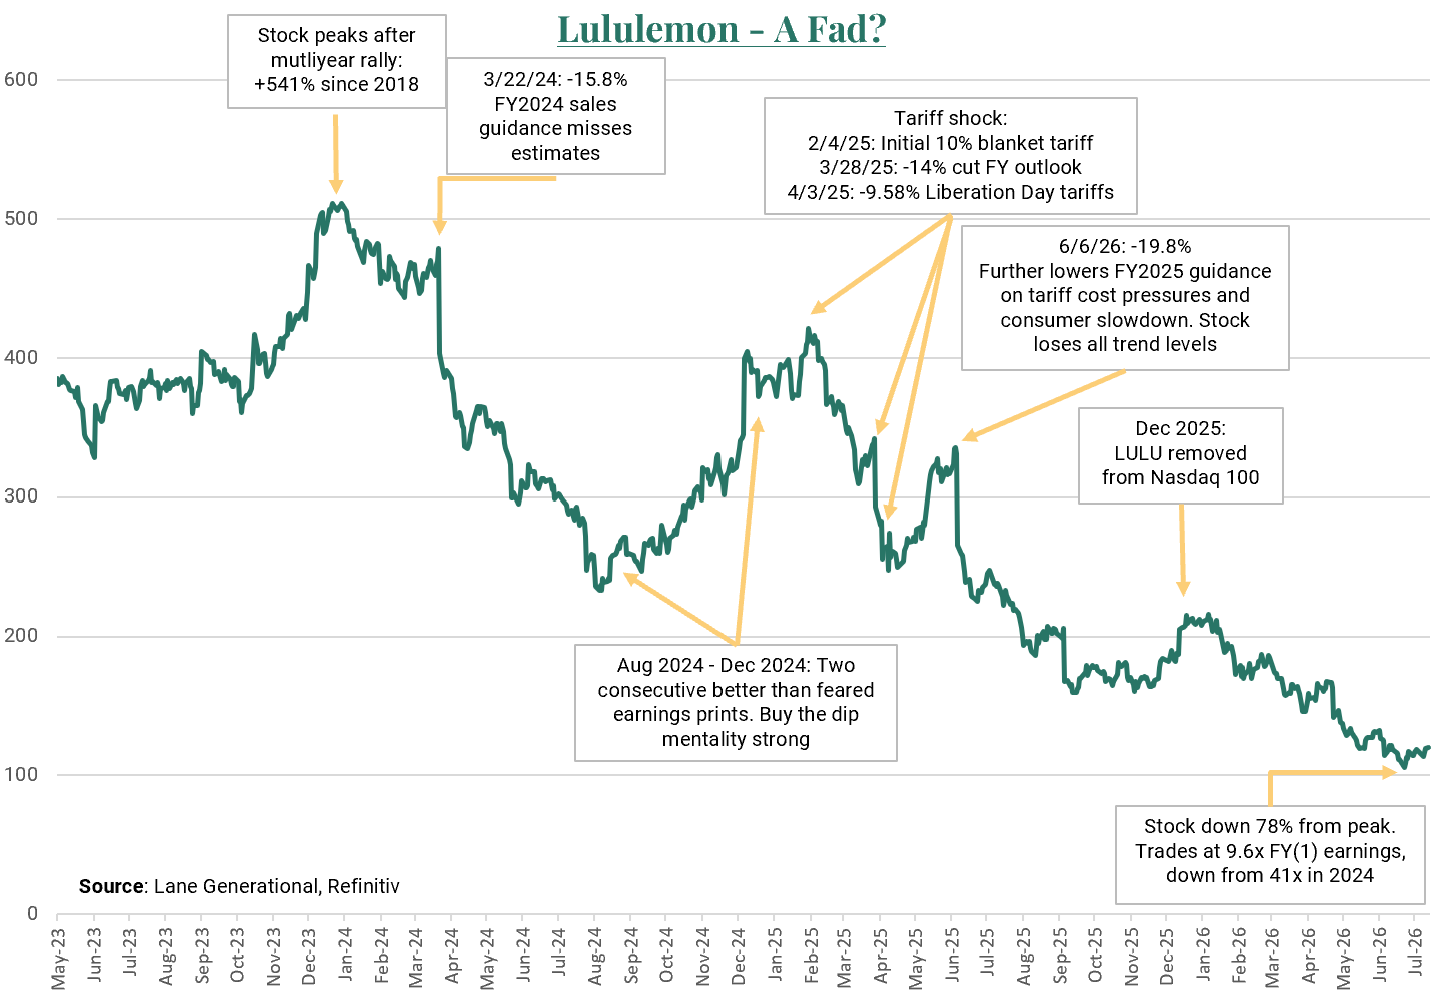
Lululemon peaked in early 2024 after a blazing, nearly ten-year, rally (again, we should know – we owned it from 2018 to early 2022). It was the “it” large-cap consumer growth stock and made its way into many large-cap-oriented hedge funds/mutual funds. In late 2023, the addition to the S&P 500 drew meaningful price-insensitive passive (and closet) indexer flows right before the top. LULU began running into trouble in early 2024, as growth rates faltered and the narrative of intensifying competition grew louder. Following a late 2024 attempt to recapture momentum, LULU formed a significant lower high ahead of the 2025 tariff drama, which would ultimately seal its fate. Note in the chart that, in every instance of a missed earnings report, the stock is aggressively punished by pod shops evidenced by double-digit single-day declines. Trend followers then exit upon the loss of key moving averages, and later fundamental managers holding through an almost two-year drawdown bail due to the opportunity cost. The company was then removed from the Nasdaq-100 index late last year, losing a key cohort of passive ownership. Today, the stock is down 78% from its peak, and its P/E multiple has compressed from 41x to 10x.
How can the market be so incredibly wrong about a $65 billion company? Put simply, this is not your grandfather’s market – no longer are the arbiters of price fundamental and value motivated. There are countless examples of this drastic mispricing and re-pricing in both directions. Interestingly, one of the world's most famed investors, Michael Burry, has been publicly short Palantir and long Lululemon. This is not investment advice, but perhaps a renowned value-oriented, active investor recognizing these clear dislocations between price and fundamentals is a testament to our thesis. This past month, Terry Smith of Fundsmith, widely recognized as a high-quality growth manager, made headlines after making the following remarks in his shareholder letter: “in the current momentum driven market, buying shares in companies which have hit a glitch is like trying to catch the proverbial falling knife. All we are getting is cut fingers as their downward spiral is exacerbated by the index momentum enhancement effect.”
In the letter, Smith effectively throws in the towel on his career-long “buy and hold” investment style, admitting he must adapt to the current market structure. He is not the first and certainly won’t be the last to voice concerns about modern market structure. We share similar fears, as the passive revolution looks unabating. As the passive share of assets under management continues to rise, we suspect its impact on momentum, volatility and liquidity will only be exacerbated. This creates a very fragile market – one with very few fundamental buyers. For the time being, we believe investors would be well served to acknowledge that the game has changed because the players at the table have changed, and to keep a watchful eye on the negative effects this market structure can deliver at both the single-stock level and index levels.
Disclaimers
The information provided is for educational and informational purposes only and does not constitute investment advice and it should not be relied on as such. It should not be considered a solicitation to buy or an offer to sell a security. It does not take into account any investor's particular investment objectives, strategies, tax status, or investment horizon. You should consult your attorney or tax advisor.
The views expressed in this commentary are subject to change based on market and other conditions. These documents may contain certain statements that may be deemed forward‐looking statements. Please note that any such statements are not guarantees of any future performance and actual results or developments may differ materially from those projected. Any projections, market outlooks, or estimates are based upon certain assumptions and should not be construed as indicative of actual events that will occur.
All information has been obtained from sources believed to be reliable, but its accuracy is not guaranteed. There is no representation or warranty as to the current accuracy, reliability, or completeness of, nor liability for, decisions based on such information, and it should not be relied on as such.
No investment strategy or risk management technique can guarantee returns or eliminate risk in any market environment. All investments include a risk of loss that clients should be prepared to bear. The principal risks of Lane Generational strategies are disclosed in the publicly available Form ADV Part 2A.
This report is the intellectual property of Lane Generational, LLC, and may not be reproduced, distributed, or published by any person for any purpose without Lane Generational, LLC’s prior written consent.
For additional information and disclosures, please see our disclosure page.
Sources:
All financial data is sourced from Refinitiv Data or Federal Reserve Economic Data (FRED) unless otherwise noted.
All charts displayed are for illustrative purposes only.
