Q1'26: The Illiquid Jenga Tower

By: Jack Schibli
As a reminder, this blog is an outlet for our thoughts, primarily on the macroeconomic environment, which contextualizes our investments. Please subscribe via the form at the bottom of the page to receive future post notifications.
If you are interested in learning more about our investment strategies, please kindly fill out our contact form here.
We are by no means the first to sound the alarm on private credit, an “alternative” asset class that has had little impact on our public markets focus to date, but the deeper we look, the more concerned we are about the potential for systemic risk to the financial system and economy down the road.
TLDR: – "too long; didn’t read."
- Institutional investors have been lured into an overallocation to private assets. In private equity, an abundance of assets under management has increased competition for deals, thereby driving up deal valuations.
- Private equity holdings are not valued by a market, but rather by (not-so) independent valuation providers, whose methods carry worrisome flaws.
- An increasing disconnect between private and public valuations has limited exit opportunities for private equity, which has reduced distributions to investors.
- Meanwhile, private credit, an asset class primarily designed to fund private equity deals, has seen a similar lack of investment principle, with lower lending standards and higher levels of leverage.
- The increasing narrative that software companies, the largest sector of private credit loans, are vulnerable to AI disruption has increased attention on private credit’s rising default rates.
- Finally, life insurers, which are heavily allocated to private credit, have been running lower regulatory capital surpluses through the financial engineering of their private equity owners.
- We believe under the right (wrong), conditions the insurance industry may pose systemic risk in the wake of a private credit fallout.
- Economic risks aside, we expect mediocre returns from the alternative asset industry as a whole due to lax underwriting driven competition to deploy capital.
Marked to Myth 🧚
To set the stage, let’s go back to the turn of the century when David Swensen, CIO of the Yale Endowment, wrote “Pioneering Portfolio Management”. In the book, he challenged conventional portfolio composition, heavily favoring alternative assets (private equity, venture capital, real estate, etc.) for their diversification and illiquidity premium. He suggested these allocations should be much higher, particularly for institutions (pensions, endowments, insurance, etc.) with similarly long time-horizons. The proof is in the pudding – Swensen’s results with Yale’s endowment consistently ranked near the top of the table. During his tenure (1985-2021), Yale produced an annual return of 13.7%, well ahead of the average endowment’s 10.3% return. Over time, the Yale model became a global standard, and allocations shifted dramatically from public to private.
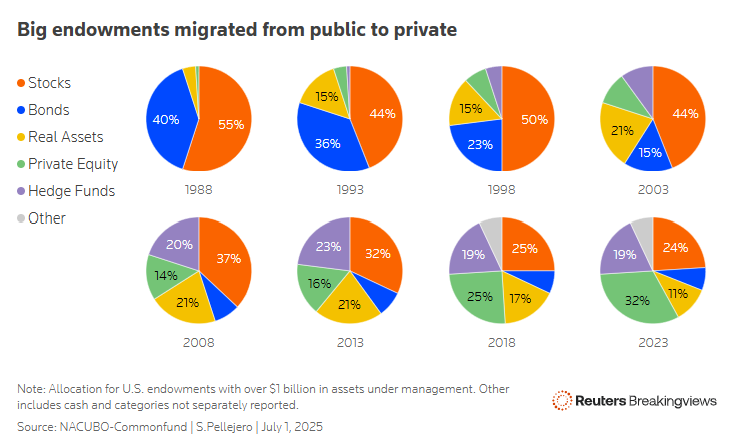
Part of the appeal of private markets has been their reported low volatility. Swensen’s approach applies Modern Portfolio Theory (MPT), a framework first developed by Harry Markowitz in 1952. MPT seeks to find the “Efficient Frontier”, which is the optimal set of asset allocations for a defined level of risk, and the key input to MPT is each asset class’s historical annualized returns relative to its annualized volatility (variance). Almost magically, private asset classes screen incredibly favorably by this logic, because they produce equity-like or better returns over the long run, with very low reported volatility, as the assets are “marked-to-market” usually quarterly at best. We believe this accounting mirage, a formulaic shortcoming of MPT, is among the key drivers of the rise in allocation to private markets.
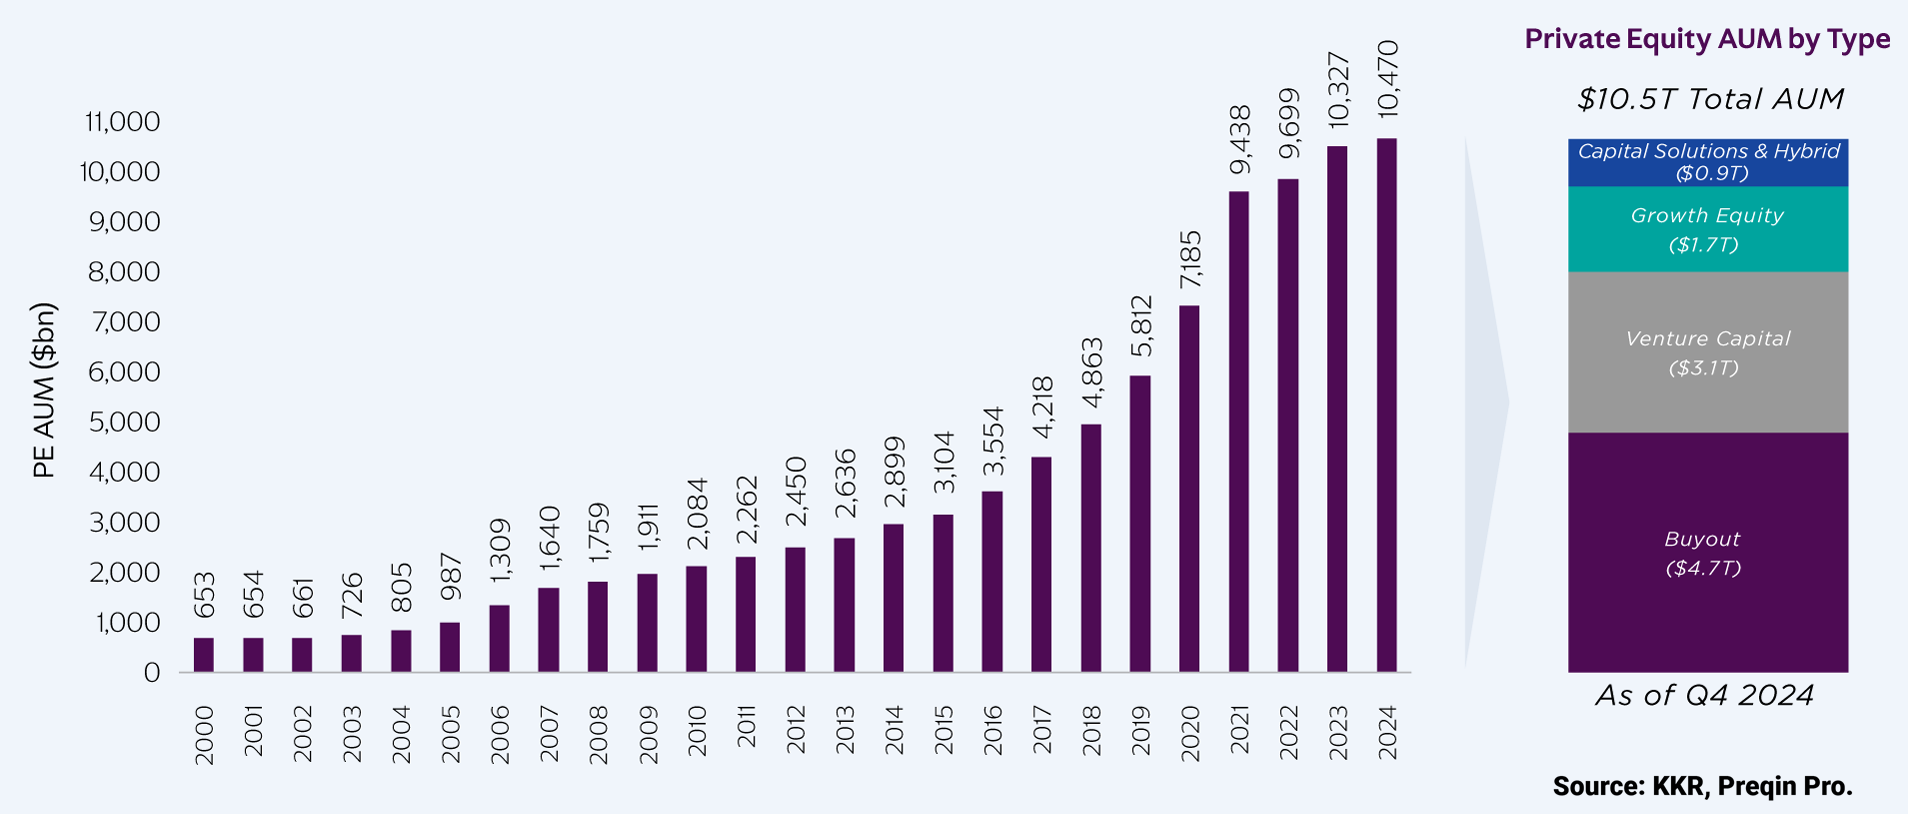
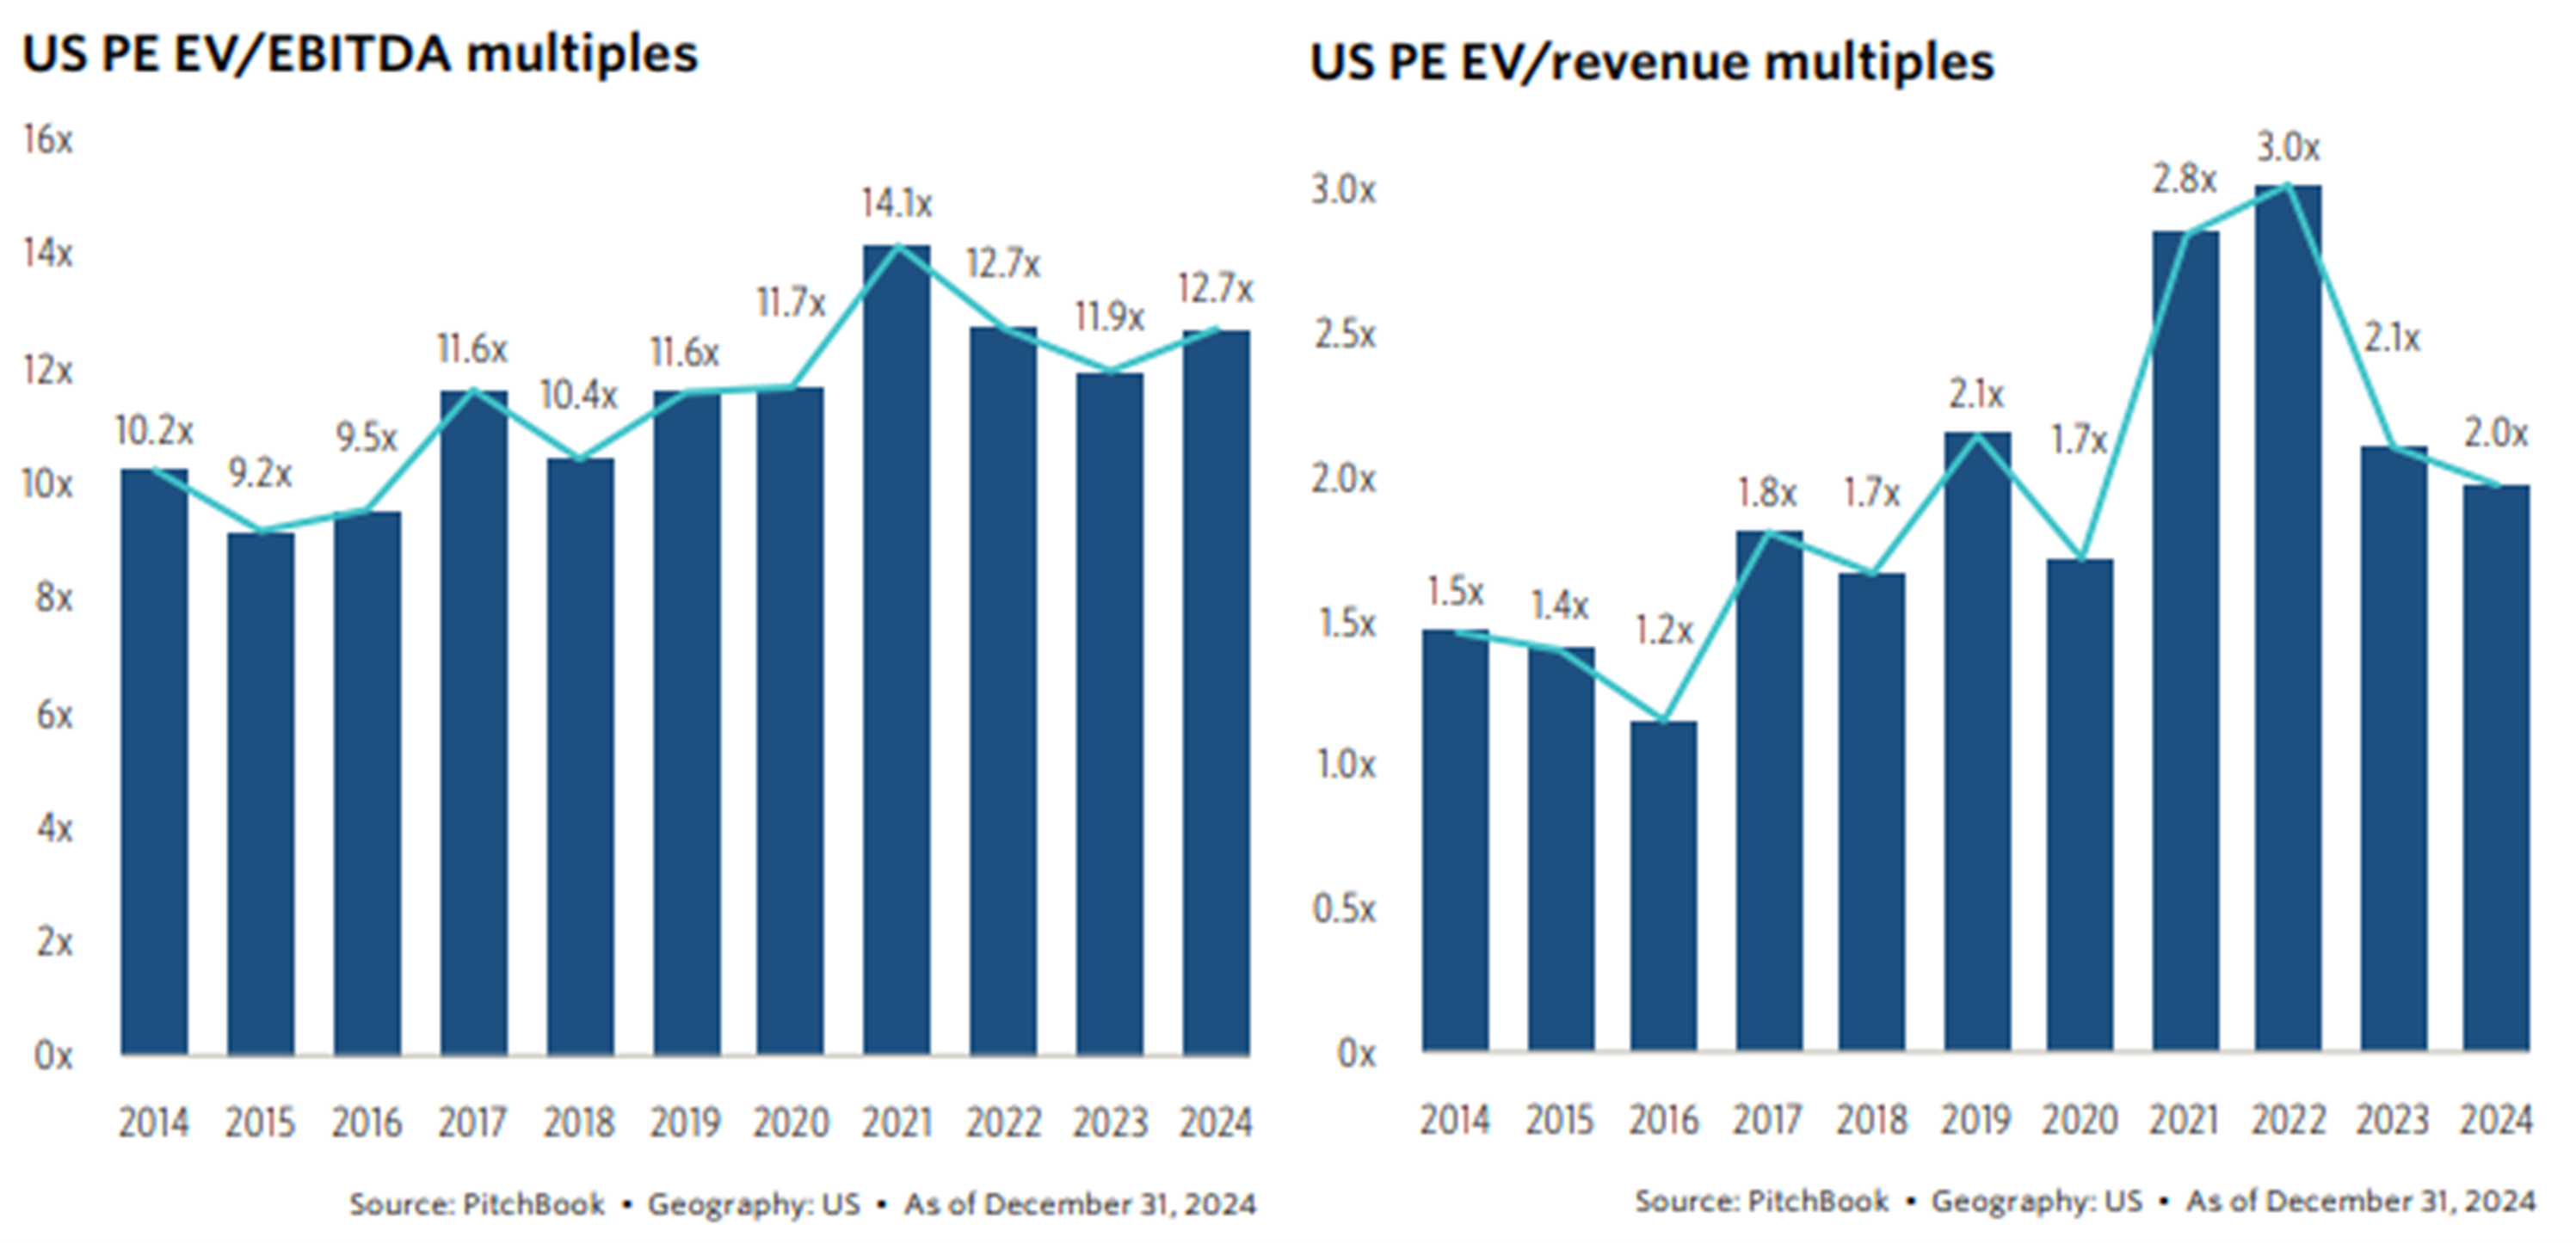
The capital pool seeking investment swelled, making the dealmaking environment more competitive. There are more private equity funds than McDonald’s franchises in the U.S. As with any market, when demand (capital) grows faster than supply (eligible companies), prices go up. Deal multiples trended steadily higher as interest rates declined, peaking in 2021 at 14.1x EV/EBITDA (nearly 40% higher than 2014) and 3.0x EV/Revenue (100% higher than 2014).
The typical leveraged buyout (LBO) model deployed by private equity is to purchase a company using a significant portion of debt, often 50-70%, backed by the target company’s assets, then cut costs, increase cash flow to pay down debt, and attempt to sell at a higher multiple. Arguably, the largest driver of success in this model is a declining interest rate environment, as debt used can be financed at cheaper rates, and lower rates also push up exit multiples. The era of declining interest rates ended in 2022, and since then, private equity has struggled, uncovering many fundamental issues masked by low rates. Historically, private equity would source the debt used in an LBO from a traditional bank, but post-2008 reforms like Dodd-Frank and Basel III regulated banks into maintaining higher capital ratios, making it less profitable to hold these types of leveraged loans on their books. Financing activity then shifted to non-banks, including broadly syndicated loans (BSL – investment banks underwrite and sell to institutions), collateralized loan obligations (CLOs – bundling hundreds of individual loans into a single vehicle), and early direct lending funds (e.g. Ares, Blue Owl). However, with the immense scale of capital flowing into private equity, lending grew commensurately, to the point that large private equity firms (e.g., Apollo, KKR, Blackstone) decided to open their own private credit arms to fund their investments. The same companies are now managing the debt and the equity, collecting fees on both, and heavily influencing valuation marks.
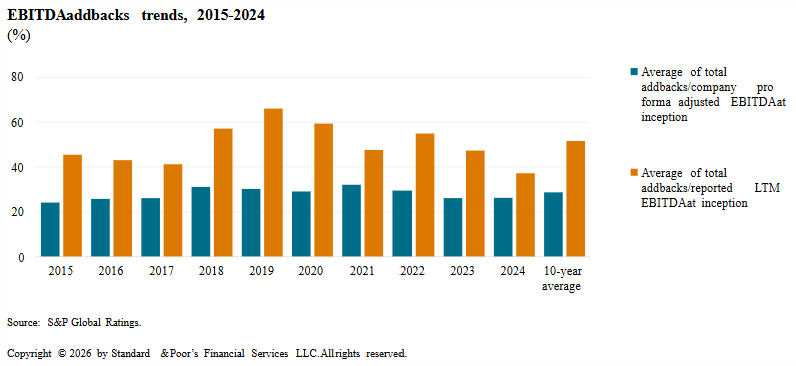
Unlike publicly listed assets, which are valued every second of every business day, private asset valuations must be generated quarterly. The managers (owners of the assets) play a very powerful role in assessing valuations, typically choosing the methodology, guiding the selection of comparable peers and, most importantly, deciding on non-GAAP add-backs. Managers then hire a third-party valuation agent to provide an “independent assessment,” which creates a significant conflict of interest because the valuation company is paid by the manager. The most common valuation technique, and most manipulable, is to calculate Adjusted EBITDA, and then assign a multiple of EBITDA (using selected comparables) to reach an enterprise value. Both components of the calculation are subject to gross inflation: generous add-backs inflate Adjusted EBITDA, and cherry-picked comps inflate the multiple. Over ten years of S&P Global’s annual EBITDA studies, add-backs on average accounted for ~52% of trailing-twelve-month EBITDA.
Let’s use a company that does $100 million in true EBITDA before add-backs. Per this study, Adjusted EBITDA would be $208 million. Using a constant EBITDA valuation multiple of 12x would result in an enterprise value of ~$2.5 billion. Generously assuming half of the add-backs are appropriate, this results in a ~$1.85 billion valuation – 26% lower. But now let’s consider the assigned 12x multiple is cherry-picked from a set of peers that are not perfectly representative, leave unfavorable comps out, or does not reflect current public market conditions, and a more appropriate multiple is 10x. Now the difference is $2.5 billion vs. $1.54 billion – a 38% discount. Inflated EBITDA also masks leverage ratios, as they are typically calculated using a Net Debt/EBITDA ratio. According to the same S&P Global study, two years after the deal, the median company’s leverage ratio was 2.7x higher. We’ll return to the importance of this discrepancy later on.
Hopefully, we’ve established that valuations in the private space are suspect at best, given the methodology most PE firms use to carry portfolio companies on their books. Of course, true value is what the market will pay. Exit opportunities for privates are most commonly an IPO or a sale to a strategic buyer. PE took full advantage of the frothy IPO market in 2021 to offload holdings to public markets, as the annual value of sales by PE-backed companies reached $527 billion, significantly above the trailing 10-year average (excluding 2021) of $152 billion. PE AUM continues to climb, but exit activity has not grown in lockstep, as transaction volume as a percentage of AUM has fallen to 10%, less than half of 2019 levels. One of the primary drivers of low exit activity is the confrontational math that selling companies on PE books at a current market multiple would result in measly returns or, in some cases, losses. Instead, PE has increasingly relied on a workaround called continuation funds – new special purpose funds raised to purchase a portfolio company from a prior fund. This transaction provides (usually partial) liquidity to investors of the original fund and continues to value the company using the same flawed methodology rather than at market prices.
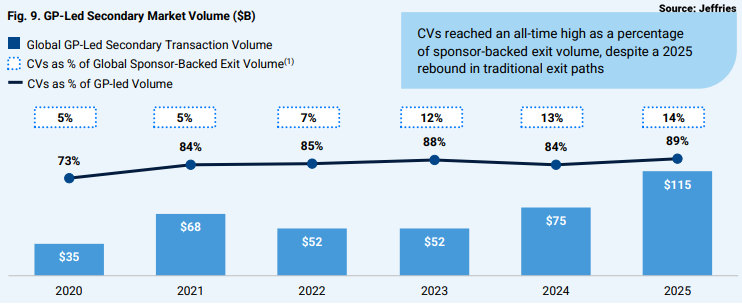
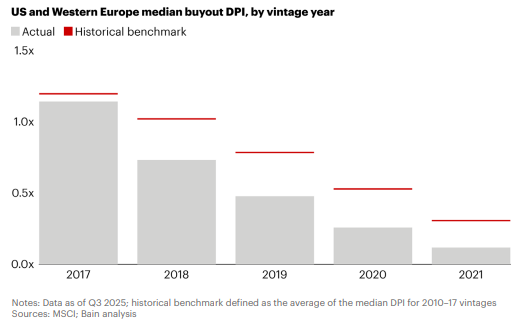
14% of “exits” in 2025 were not real transactions tested by market conditions, but merely a transfer of ownership from one set of limited partners to another. Continuation vehicle transactions are typically completed at 90-100% of stated NAV, purportedly validating NAV and often cited as comps in the future, but it’s circular validation, not price discovery. The trend is clear – PE funds cannot find sufficient exit liquidity to match the elevated valuations on their books, forcing them to hold on to companies longer and find creative ways to provide limited partners with liquidity. Bain notes the average holding period has risen to seven years, up from five years in 2010. Bain also finds that recent fund vintages have been meaningfully underperforming historical benchmarks for distributions. Distributions to Paid-in capital (DPI) measures the amount of capital investors have been paid out relative to their invested capital. At some point, investors will want to see real cash returns
Saving Private Credit 🪖
The same capital flows that have inflated private equity created the demand for private credit, which inherited many of the same structural flaws. Private Credit’s emergence as an institutional asset class is still nascent but growing rapidly. Assets Under Management now exceed $2 trillion, up from $760 billion in 2020. As noted, the growth has been driven by heightened demand for private equity deal financing and the entrance of large private equity sponsors to the credit side. These managers, including PE giants Apollo, KKR, and Blackstone, are now both the borrower and the lender in many of the same deals. Using weighted average AUM, 81% of private credit managers also manage private equity funds.
The significant growth in AUM and subsequent sponsor demand to close deals in a competitive environment has resulted in markedly lower lending standards than typically found in bank lending or public credit. Lenders have accepted weaker covenants, given borrowers more optionality, and taken on additional leverage. Meanwhile, borrowers are thrilled with the ease and speed of execution, additional flexibility, and fewer disclosure requirements, with many taking advantage of these better terms to take on more debt. For example, the use of Payment-in-Kind (PIK) has increased dramatically alongside private credit growth. PIK allows borrowers to pay interest via additional debt, rather than cash flow. This is quite literally the definition of kicking the can down the road. The borrower accrues additional principal, but the lender recognizes income even though no cash changes hands.
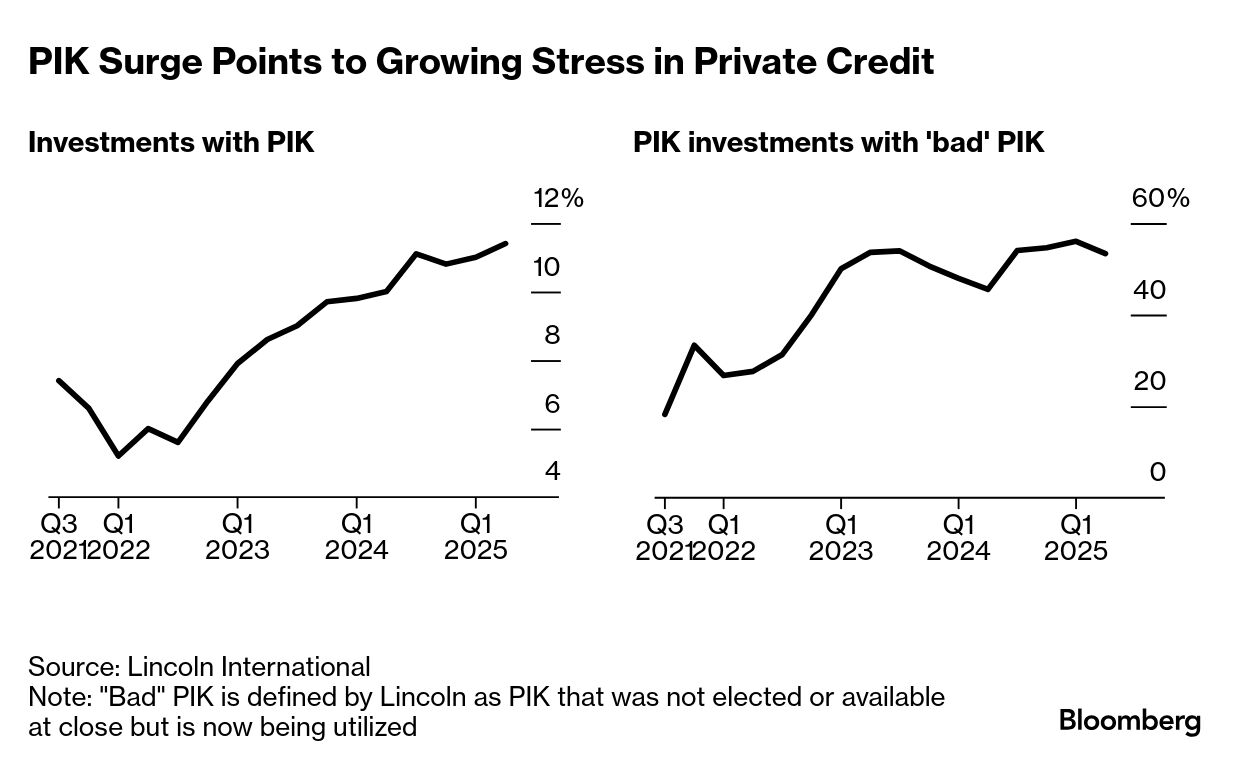
Per Lincoln International, “bad PIK” loans (PIKs used as a toggle rather than at loan inception) accounted for 6.4% of all loans in the fourth quarter of 2025. In theory, this can be viewed as a shadow default rate, as it reflects poor liquidity conditions at the borrower and is a leading indicator of official defaults. When added to the historical annual default rate of ~2.5%, PIK pressure could signal default rates in the 9% range ahead. Investing in credit differs significantly from investing in equity. While the equity model is predicated on picking winners, which typically more than offset losers, the credit model is based on avoiding losers due to the fixed nature of returns. Let’s say private credit annual returns are in the 10% range – this is directly tied to the interest rates lenders are receiving on loans. If the annual default rate is 6%, there goes 60% of the annual return. You might as well buy the 10-year note at ~4.25%.
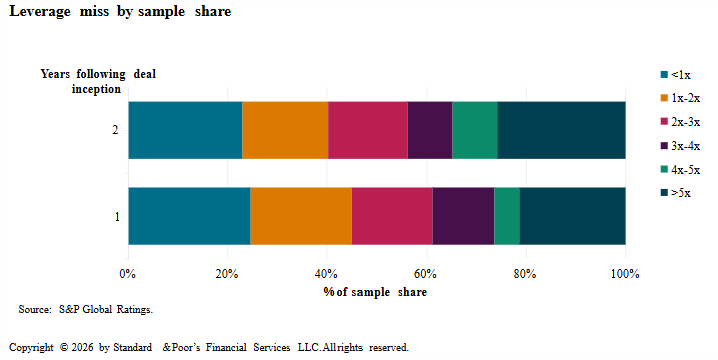
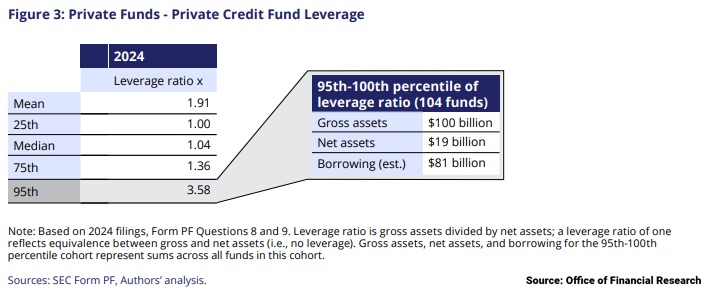
There are multiple layers of leverage to consider in private credit. First, is the Loan-to-Value (LTV) the PE sponsor is using, or, in other words, the percentage of the target company that is being financed with debt. Next is the deal-level leverage, which is specific to the company’s margin profile rather than its valuation, and is typically calculated as net debt to (heavily adjusted) EBITDA. According to S&P Global, median borrower level leverage ticked up to 6.64x EBITDA in 2025. You would be hard-pressed to find many public equity managers willing to bet on a company so heavily indebted. Lastly, many of the private credit funds are employing fund-level leverage to juice returns, adding an additional layer of risk. While most funds are very modestly levered (if at all), there are some concerning outliers with significant leverage seen below.
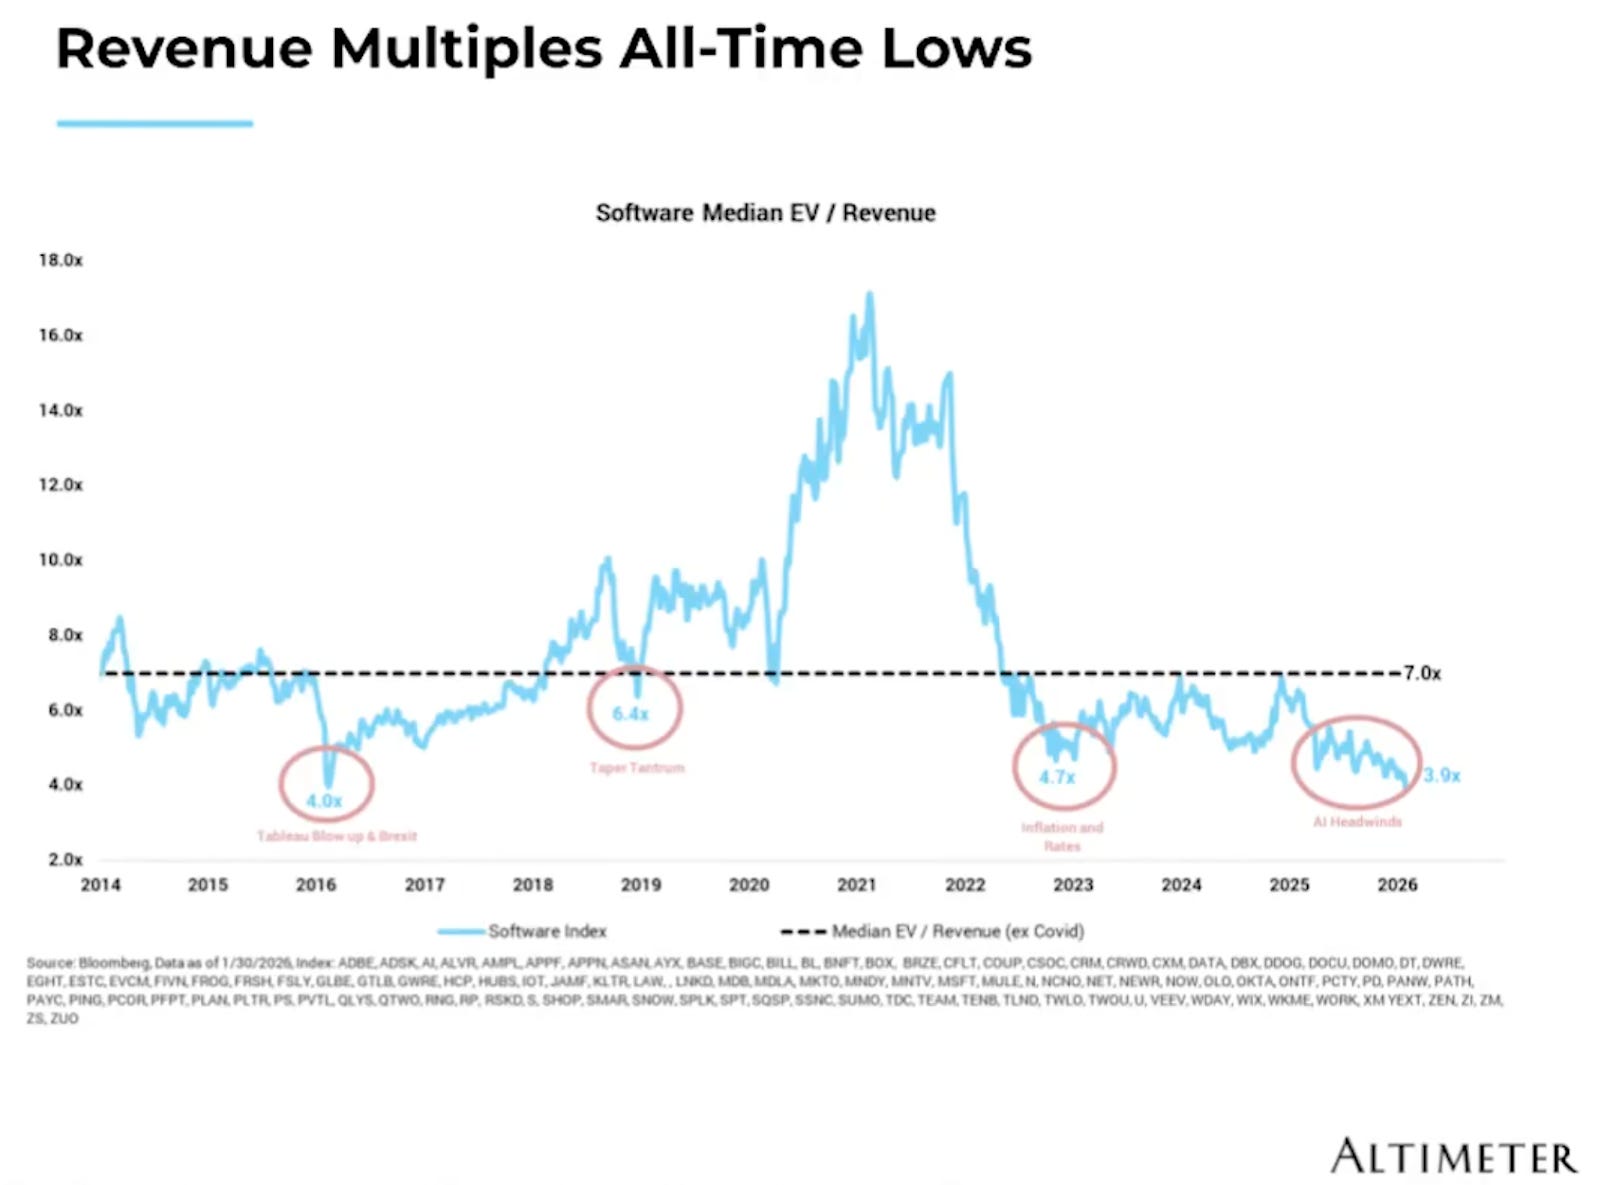
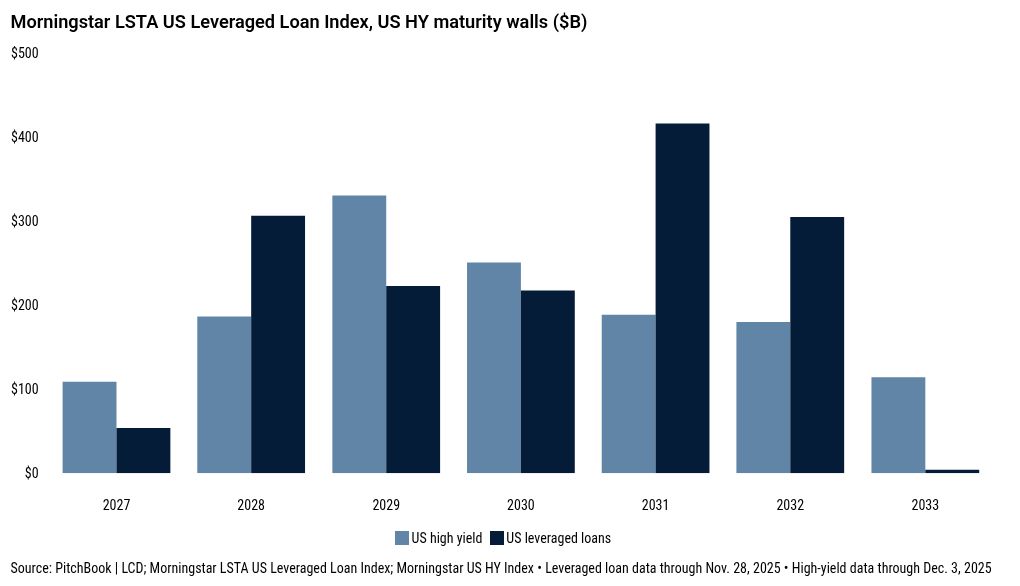
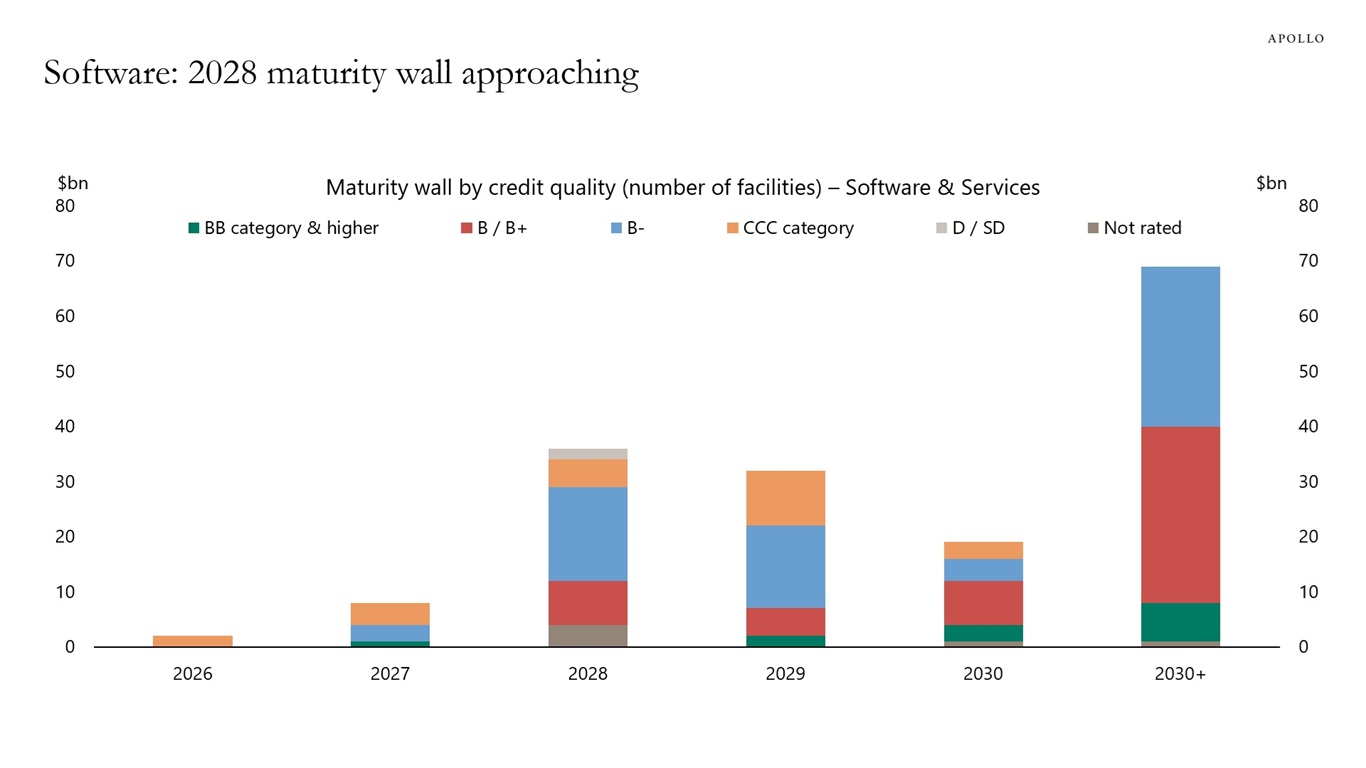
These structural vulnerabilities — high leverage, weak covenants, PIK masking distress — have recently been thrust into the limelight through private credit’s outsized exposure to software businesses, which are currently the proverbial deer in the AI headlights. Artificial intelligence, via the likes of Anthropic’s Claude Code and OpenAI’s Codex, has supercharged humans’ ability to develop software. Non-coders can now “vibe code” (enter a prompt and produce a working result) their own basic applications, and competent coders are now supercharged to 10x their output. Given this new era of software development abundance, public markets have heavily sold off software companies on the narrative that low barriers to entry will lead to increased competition and reduced pricing power – the IGV software index was down 24% in the first quarter of 2026. There is also concern that software companies, which typically charge per-seat, will face headwinds from white-collar job losses resulting from AI productivity gains. We believe the impact will be nuanced, with certain components of the industry poised to benefit from AI, while others (generally smaller, point solutions) may rightfully go extinct. Software has historically been seen as an impenetrable business model, thanks to very high margins and recurring revenue, investors have been willing to pay very high multiples of revenues, EBTIDA, and earnings. Over the last ten years, the median EV/Revenue multiple for public software companies has averaged 7x, excluding the upside outliers during the Covid era. Today, the median EV/Revenue is at an all-time low of 3.9x as investors question the longevity of software’s cash flows in an AI world.
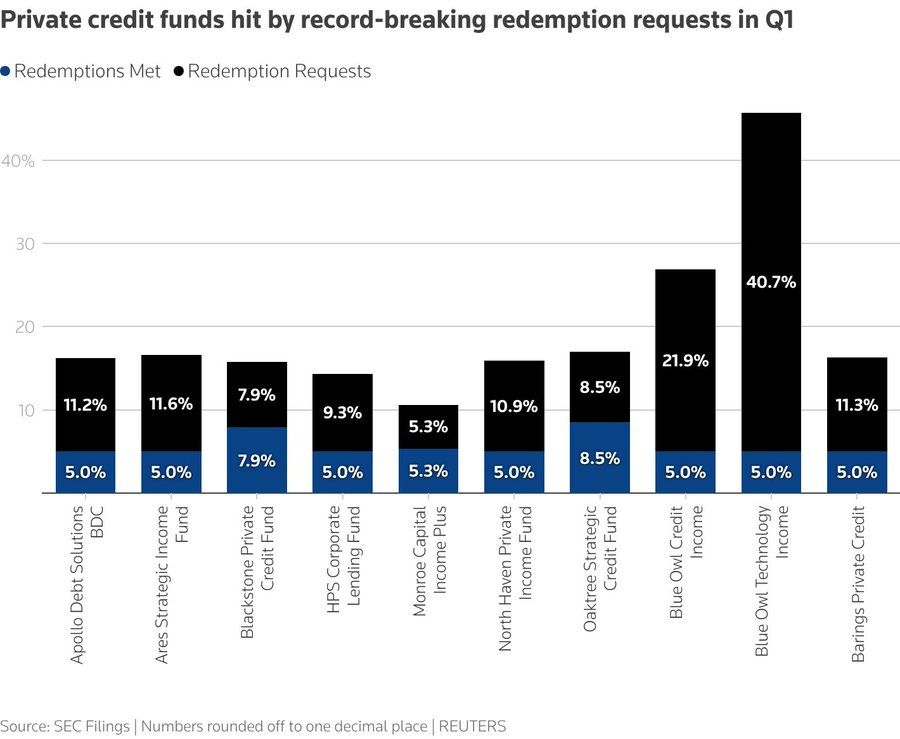
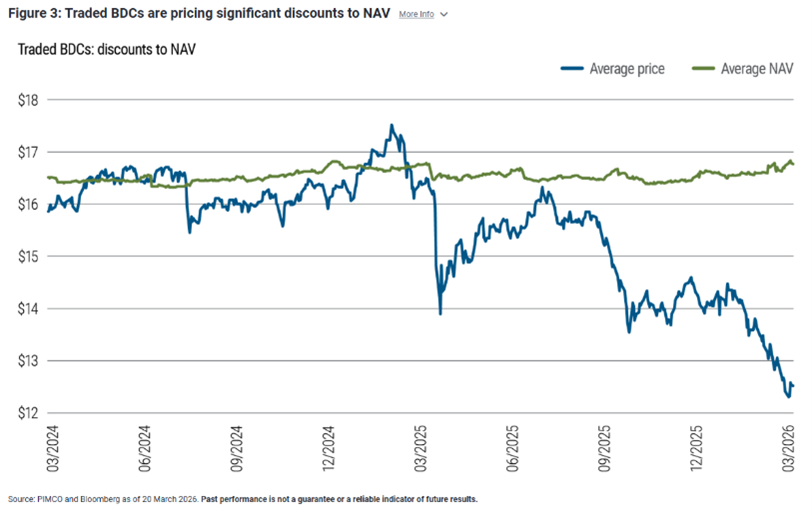
According to the BIS, private credit exposure to software reached 19% in 2025. If AI truly is the disruptive threat to software that public markets are pricing in, then there will likely be substantial default rates in this cohort. We would argue that smaller, point-solution software companies, like those typically targeted by private equity firms, are most at risk to AI. To make matters worse, private software companies are typically heavily leveraged, meaning most of their cash flow is used to service debt, hindering their ability to invest in adapting their business to succeed in an AI-first world. By contrast, leverage among public software companies is de minimis. This may be the canary in the coal mine for private credit, which was already facing structural issues before AI arrived. Major cracks began to show last fall with the large bankruptcies of First Brands Group (an auto parts maker, $12 billion) and Tricolor (an auto lender, $1 billion). Highlighting the mark-to-market issues, BlackRock recently re-rated a $25M private loan to zero, just three months after marking it at par. These jitters triggered a wave of redemption requests in the first quarter, as shown below. However, funds have gates that typically limit redemptions to 5% per quarter. Further illustrating current concerns, publicly listed private credit funds via BDCs (business development corporations) have traded down meaningfully, as low as 72% of Net Asset Value.
The continuation of quarterly redemptions, despite a 5% gate, is likely to have reflexively negative impacts. Initially, managers can liquidate high-quality assets in their portfolio at little to no discount to meet redemption requests, but with each passing quarter, they will have to find buyers for lower-quality credits. This also leaves the residual portfolio more concentrated in lower-quality or more illiquid credits
Web of Re-Insurance 🕸️
In 2009, private equity group Apollo Global founded Athene, now among the nation’s top life insurers. Apollo strategically set out to find “permanent” capital for its funds through the life insurance industry, formalizing a playbook that many of its peers would go on to replicate. Insurer capital was an answer to an industry pain point – the cyclical nature of private equity funding: raise a fund, deploy it, raise a fund, deploy it, etc. Today, most major private equity managers own insurance companies and have used their influence to push the increasing allocation to alternative assets to an extreme. Per Moody’s, one-third of the insurance industry’s $6 trillion in assets are parked in some form of private credit. $225 billion of these loans are in the form of NAV loans, loans to funds where NAV is collateral, and Apollo expects this to grow to over $2.5 trillion by 2030. Funds are using this capital to shore up portfolio companies, redeploy into new deals, and also cash out investors in previous funds due to the lack of exit opportunities. Under the direction of their private equity owners, insurance companies have been purchasing offshore reinsurance. Per regulatory requirements, having reinsurance allows insurers to hold less capital on their balance sheets, and the push towards entities in Bermuda and the Cayman Islands, home of looser regulations and lower taxes, further improves this equation. The insurance industry purchased $928 billion in reinsurance in 2024, 60% of which from offshore entities, nearly double the 2019 percentage. Shockingly, many of these offshore reinsurers are owned by the insurance companies themselves, eliminating any risk diversification. In short, private equity has gamified regulatory capital ratios, putting insurance companies in a precarious position should asset values fall.
To make matters worse, it appears ratings agencies may be playing a similar role to that of 2008. In 2024, the National Association of Insurance Commissioners (NAIC) found that smaller rating agencies Egan Jones, Morningstar DBRS, and Kroll, which provided 86% of ratings for insurers’ private credit holdings, had produced ratings three notches higher on average than the NAIC’s own internal Securities Valuation Office[i]. High ratings further reduce the insurers’ regulatory capital requirements, and a downward re-rating of credit would put pressure on surplus capital among insurance companies with high exposure to private credit. In fact, we already have an example. Private equity-owned insurer PHL Variable Insurance Co. first entered rehabilitation with the State of Connecticut in early 2024 after posting a $135 million capital deficit at year-end 2023. After many months of attempting to stave off bankruptcy, Connecticut regulators found PHL’s (and its captive reinsurer, Concord Re) capital shortfall instead exceeded $2 billion. Sadly, for policyholders, most states cap claims against insolvent insurers between $250,000 and $500,000, meaning many retirees will not receive what they are owed. We’ll cite Grant’s Interest Rate Observer’s excellent commentary on First Allmerica Financial Life Insurance Co., owned by PE-firm KKR, which might just be next in line.
"At year-end 2024, First Allmerica held $136.9 million in surplus against $15.3 billion in liabilities, giving KKR’s carrier a 111.7 times leverage ratio. The plain meaning of which is that a loss of just 0.9% could wipe out that sliver of capital. Not to worry, however, as Allmerica leans on other Global Atlantic entities, including a pair based in Bermuda, to provide $15.5 billion in reinsurance. Using captive reinsurers, especially those based in sun-soaked and lightly regulated tropical settings, is the way many p.e.-affiliated carriers economize on capital. Lightly capitalized though it is, First Allmerica reinsures (or had reinsured, as of Dec. 31, 2024) $16.7 billion’s worth of risk for such companies as Athene Life Insurance Co. of New York (a member of Apollo’s insurance empire), Equitable Financial Life Insurance Co. (the eponymous insurer’s main business unit), Metropolitan Life Insurance Co., Mutual of America Life Insurance Co. and USAA Life Insurance Co. of New York. Notably, the coverage that Allmerica extends to those five non-KKR insurers is greater than each of the quintet’s individual surplus levels. A default by any company along the chain would make waves. If First Allmerica were to vanish, its five aforementioned reinsurance cedents could be rendered insolvent. Say that Equitable needed to draw down its $3.8 billion in reinsurance cover. Given First Allmerica’s thin capital position, the KKR-owned insurer would probably have to draw on its own reinsurance from its affiliates in Global Atlantic. In a crisis, cross coverage can propagate problems.” – Evan Lorenz in Grant’s Interest Rate Observer, March 2026[ii].
Would you rather pay a 10% early withdrawal fee on a $5 million policy and receive $4.5 million or receive $250,000 to $500,000 if your insurer goes under? If PHL is the canary in the coal mine, then this is the math policyholders will be considering if a panic ensues. A wave of early redemptions would force insurers to liquidate assets and likely put on full display many of the issues we’ve discussed, from the overstatement of private fund NAVs to captive offshore reinsurance. This is a box of tinder awaiting a match, and a “run on the bank” in a $6 trillion-dollar industry is certainly of the size and scale to be systemic.
Aside from monitoring economic risks, we confidently conclude that the alternative asset industry is likely in for a period of below-average returns in aggregate for fund vintages over the last several years. In private equity, the allocation of capital at high multiples (particularly to companies at risk of AI disruption) during the low-interest rate era will face meaningful headwinds, as evidenced by the low-exit opportunity and higher interest rate environment. Meanwhile, private credit’s loose lending practices at high levels of leverage will also prove a challenging hurdle to overcome, as default rates far exceed expectations. At the end of the day, “private” equity is still equity, and “private” credit is still credit. Both have the same economic exposure, and are not the uncorrelated, low-volatility asset class allocators have been led to believe. We believe there has been an enormous misallocation of capital to an industry based on historical returns, achieved in a declining interest rate environment with low competition, that will be difficult to replicate.
Disclaimers
The information provided is for educational and informational purposes only and does not constitute investment advice and it should not be relied on as such. It should not be considered a solicitation to buy or an offer to sell a security. It does not take into account any investor's particular investment objectives, strategies, tax status, or investment horizon. You should consult your attorney or tax advisor.
The views expressed in this commentary are subject to change based on market and other conditions. These documents may contain certain statements that may be deemed forward‐looking statements. Please note that any such statements are not guarantees of any future performance and actual results or developments may differ materially from those projected. Any projections, market outlooks, or estimates are based upon certain assumptions and should not be construed as indicative of actual events that will occur.
All information has been obtained from sources believed to be reliable, but its accuracy is not guaranteed. There is no representation or warranty as to the current accuracy, reliability, or completeness of, nor liability for, decisions based on such information, and it should not be relied on as such.
No investment strategy or risk management technique can guarantee returns or eliminate risk in any market environment. All investments include a risk of loss that clients should be prepared to bear. The principal risks of Lane Generational strategies are disclosed in the publicly available Form ADV Part 2A.
This report is the intellectual property of Lane Generational, LLC, and may not be reproduced, distributed, or published by any person for any purpose without Lane Generational, LLC’s prior written consent.
For additional information and disclosures, please see our disclosure page.
Sources:
All financial data is sourced from Refinitiv Data or Federal Reserve Economic Data (FRED) unless otherwise noted.
All charts displayed are for illustrative purposes only.
[i] Grant’s Interest Rate Observer. Vol 44, No. 2. January 2026.
[ii] Grant’s Interest Rate Observer. Vol 44, No. 5. March 2026.